The U.S. Department of Labor has developed an automated occupational information database, O*NET, that identifies and describes work content, work skills, and training requirements for all jobs across the country in all sectors of the economy. Much of the occupational information contained in this report is derived directly from the O*NET database, and supplemented with information from the Bureau of Labor Statistics, Census Bureau, and Labor Market and Career Information.

| Industry | % of Business Operations Specialists, All Other employed | Annual Growth Rate |
|---|---|---|
| Colleges, universities, and professional schools | 5.2 | 0.45 |
| Management, scientific, and technical consulting services | 4.7 | 1.06 |
| Employment services | 3.3 | 0.18 |
| Insurance carriers | 2.8 | 0.59 |
| Computer systems design and related services | 2.4 | 1.30 |
| Elementary and secondary schools | 2 | 0.04 |
| 2023 Statewide average hourly wage | $41.21 |
| 2023 National average hourly wage | $42.85 |
| 2022 National employment | 1,174,800 |
| 2022 Texas employment | 74,086 |
| Texas projected employment by 2032 | 86,957 |
| Texas projected annual employment and Turnover openings through 2032 | 8,145 |

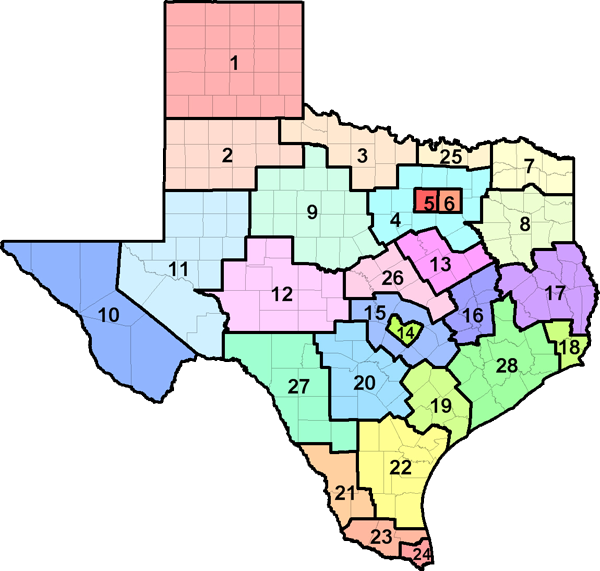
| Region | Employment | Projected Employment 2032 | Projected Annual Openings 2032 |
Annual Growth Rate |
Average Income |
|---|---|---|---|---|---|
| Texas (all regions) | 74,086 | 86,957 | 8,145 | 1.61% | $85,715.00 |